III. EDA of BSSeq data generated from in different non-model organisms
BSXplorer enables comparison of methylation data across different organisms.
It can be done using:
Python API
Start with import of genome annotation data for species of interest.
arath_genes = bsxplorer.Genome.from_gff("arath_genome.gff").gene_body(min_length=0)
bradi_genes = bsxplorer.Genome.from_gff("bradi_genome.gff").gene_body(min_length=0)
mouse_genes = bsxplorer.Genome.from_gff("musmu_genome.gff").gene_body(min_length=0)
Next, read in cytosine reports for each sample separately:
window_kwargs = dict(up_windows=200, body_windows=400, down_windows=200)

arath_metagene = bsxplorer.Metagene.from_bismark("arath_example.txt", arath_genes, **window_kwargs)
bradi_metagene = bsxplorer.Metagene.from_bismark("bradi_example.txt", bradi_genes, **window_kwargs)
musmu_metagene = bsxplorer.Metagene.from_bismark("musmu_example.txt", mouse_genes, **window_kwargs)
To perform comparative analysis, initialize the bsxplorer.MetageneFiles
class using metagene data in a vector format, where labels for every organism are provided explicitly.
Next, apply methylation context and strand filters to the input files:
filtered = files.filter("CG", "+")
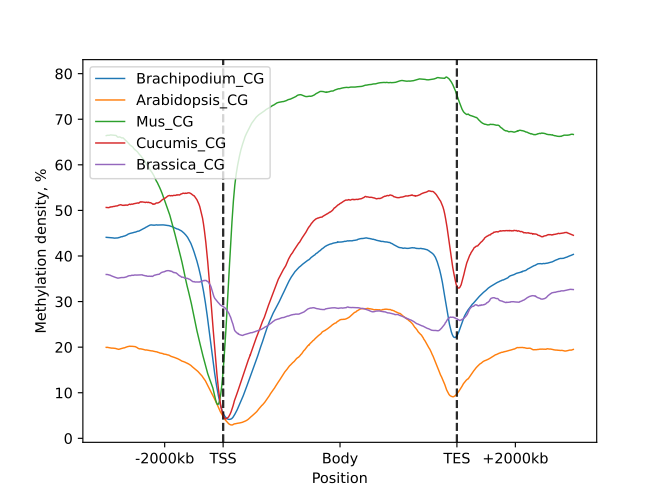
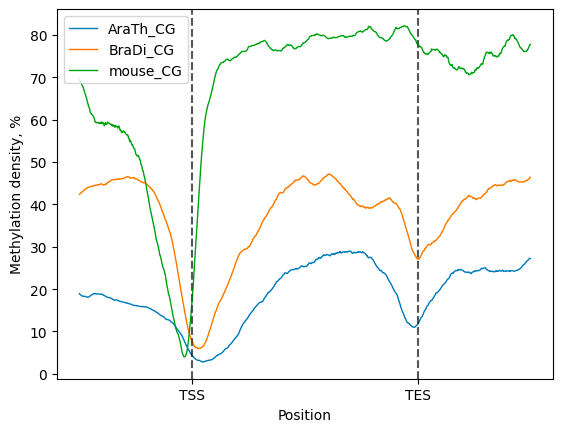
Then, a compendium of line plots to guide a comparative analyses of methylation patterns in different species is constructed:
filtered.line_plot(smooth=50).draw_mpl()
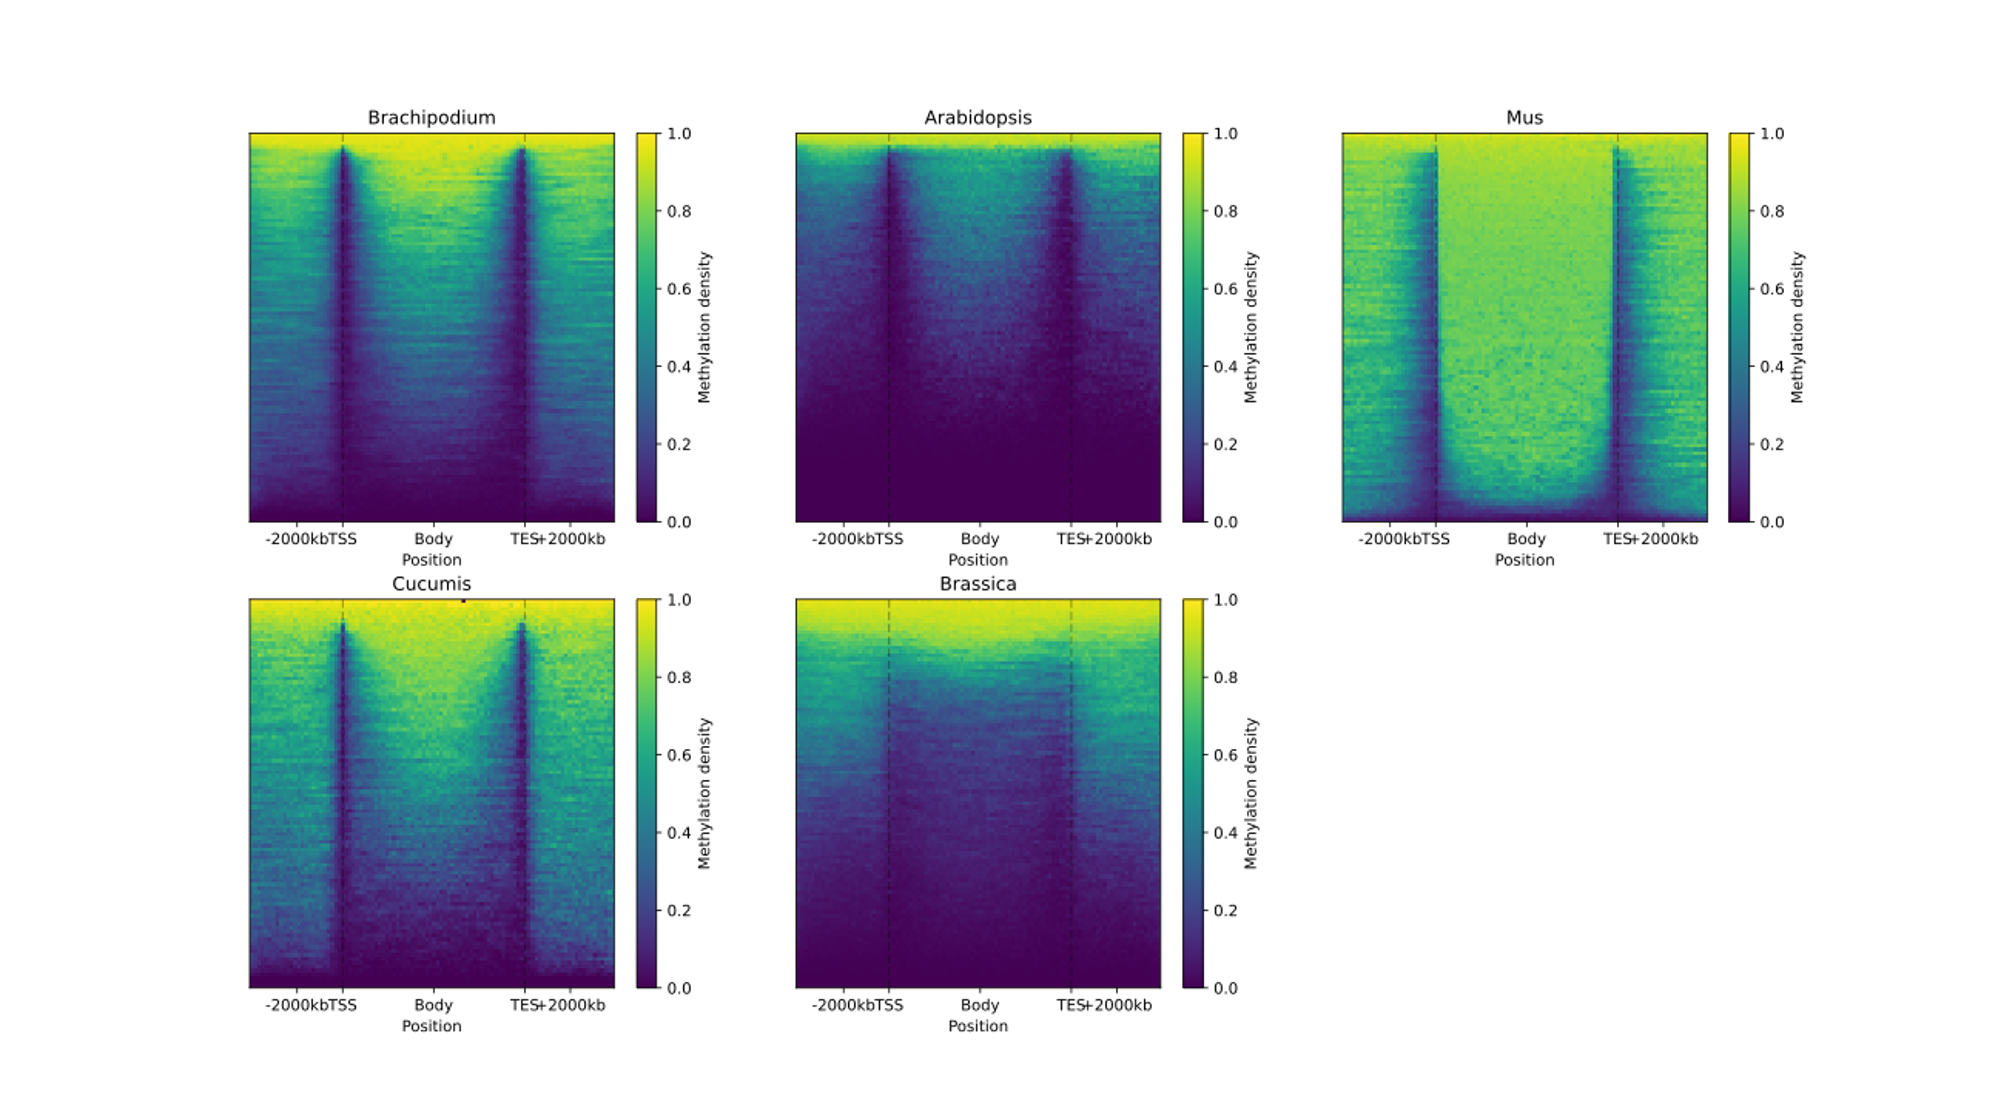
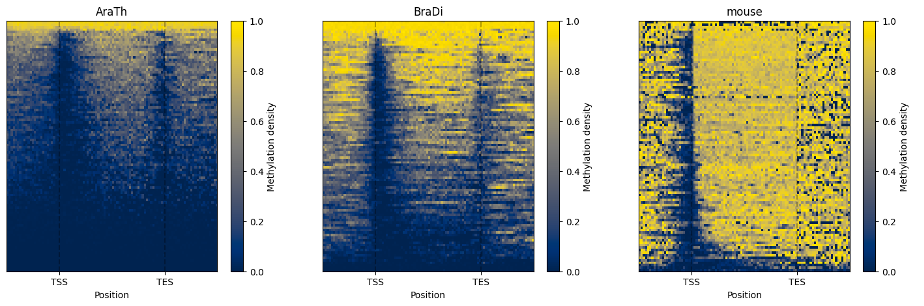
The line plot representation may be further supplemented by a heatmap:
filtered.heat_map(100, 100).draw_mpl()
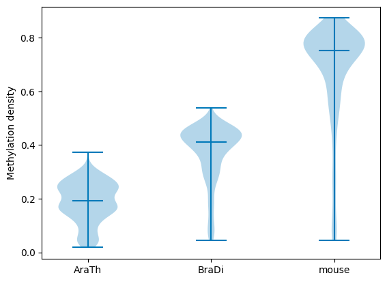
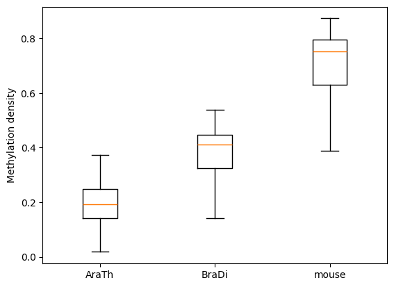
To examine and highlight differences in methylation patterns between different organisms, summary statistics is made available in a graphical format.
filtered.box_plot(violin=True).draw_mpl()
filtered.box_plot().draw_mpl()
Console script
BSXplorer enables comparison of methylation data across different organisms using the console command:
bsxplorer-metagene -o IntraMetageneReport --dir IntraMetagene -u 250 -d 250 -b 500 -S 50 --ticks \\-2000bp TSS Body TES \\+2000bp -C 0 -V 100 -H 100 --export pdf intra_conf.tsv
A user can obtain a complete list of parameters by using the command bsxplorer-metagene --help.
The configuration file has the following structure:
Header should NOT be included in real config file.
sample group |
Path to report |
Path to genome |
Flank length |
Minimal length |
Region_type |
|---|---|---|---|---|---|
Mus |
SRR16815382_Mus_musculus.CX_report.gz |
Mus_musculus_genomic.gff |
2000 |
0 |
gene |
Arabidopsis |
A_thaliana.txt |
A_thaliana_genomic.gff |
2000 |
0 |
gene |
Brachipodium |
Brachypodium_distachyon_leaf.txt |
Brachypodium_distachyon_genomic.gff |
2000 |
0 |
gene |
Cucumis |
C_sativus.txt |
C_sativus_genomic.gff |
2000 |
0 |
gene |
Brassica |
DRR336469.CX_report.txt.gz |
genomic.gff |
2000 |
0 |
gene |
Below is a list of plots generated for the CG methylation context, as presented in the HTML report file.