Lineplot
This tutorial will explain you how to calculate, visualize and configure line-plots.
Single metagene
Initialization
from bismarkplot import *
# Firstly, we need to read the regions annotation (e.g. reference genome .gff)
genome = Genome.from_gff("path/to/genome.gff")
# Next we need to filter regions of interest from the genome
genes = genome.gene_body(min_length=0, flank_length=2000)
# Now we need to calculate metagene data (e.g. from Bismark output)
metagene = bismarkplot.Metagene.from_bismark(
file="path/to/CX_report.txt",
genome=genes, # filtered regions
up_windows=500,
body_windows=1000,
down_windows=500
)
# Our metagene contains all methylation contexts and both strands, so we need to filter it
# (OPTIONAL for line-plot)
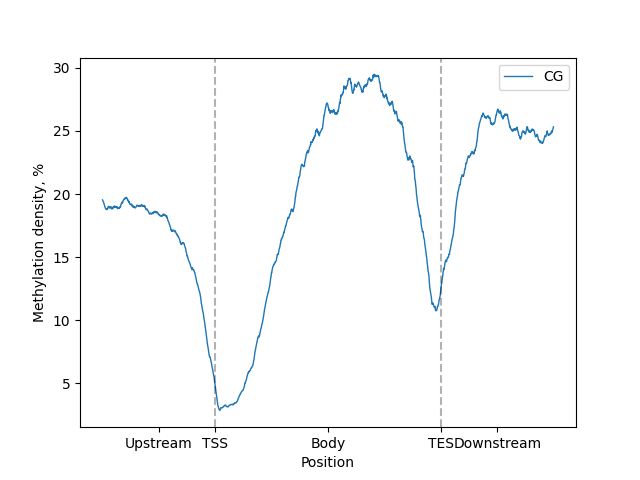
filtered = metagene.filter(context="CG", strand="+")
# LinePlot now can be created
lp = filtered.line_plot()
Basic usage
The easiest way to get the plot is to call .draw_mpl() or .draw_plotly() methods to get matplotlib and Plotly
versions of plots respectively
figure = lp.draw_mpl()
figure.show()
Or for Plotly version
figure = lp.draw_mpl()
figure.show()
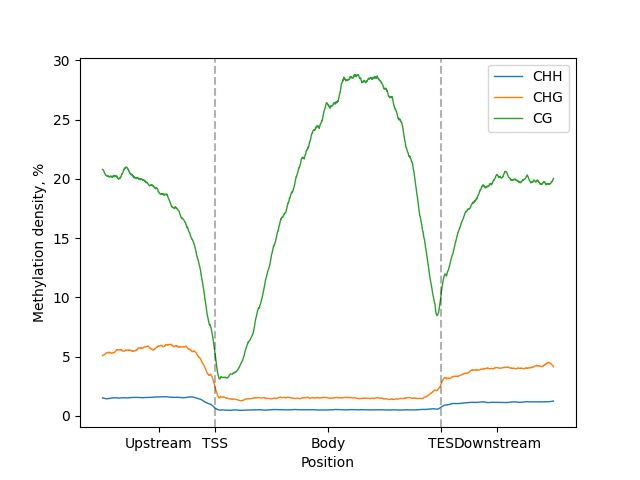
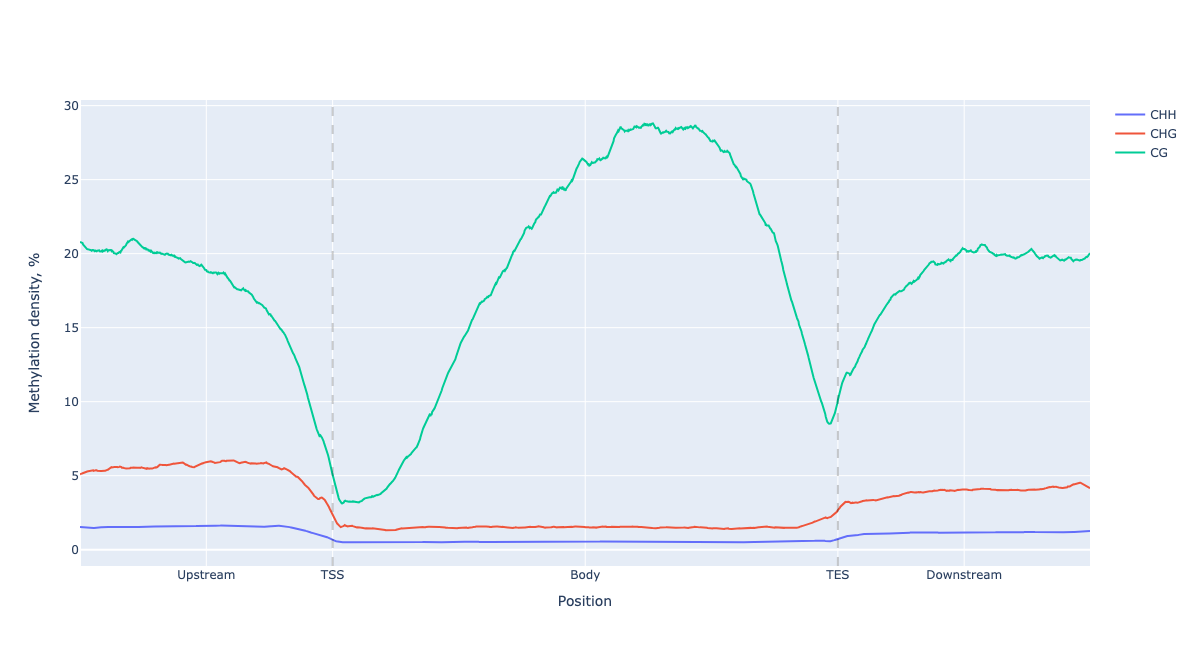
No Metagene filtering
If metagene was not filtered by context, line-plot for all contexts on the same figure will be created
lp = metagene.line_plot()  # Metagene from previous example

figure = lp.draw_mpl()
figure.show()
And for plotly version
figure = lp.draw_mpl()
figure.show()
Advanced configuration
Examples for matplotlib version of plots will be shown, but Plotly version is identical.
For all examples we use metagene filtered by CG context.
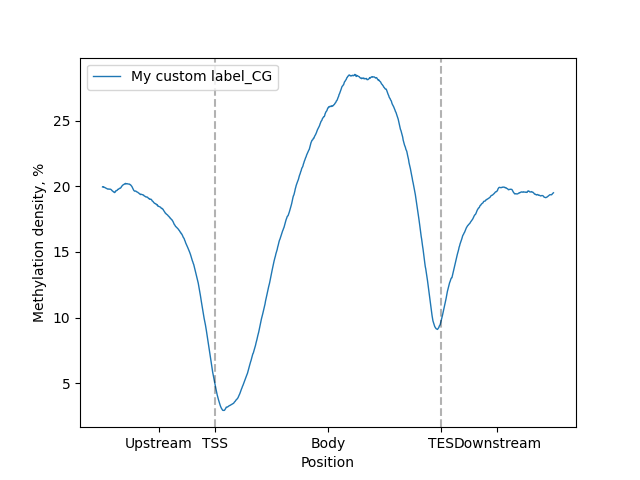
label parameter
Custom label can be set for line-plot using label parameter:
lp.draw_mpl(label="My custom label")
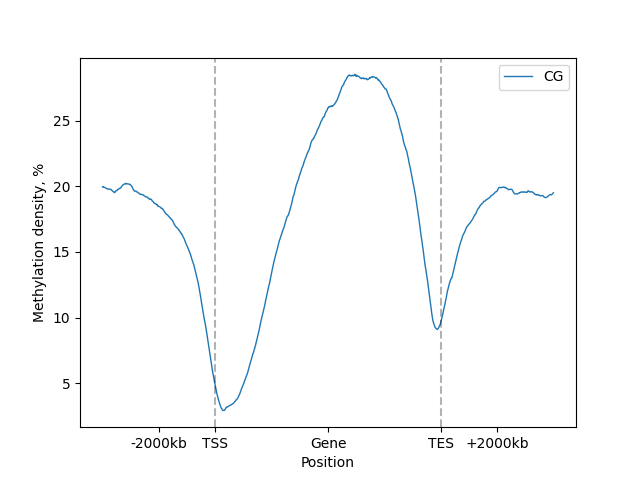
minor_labels parameter
Labels for upstream, body and downstream regions can be changed to custom, but exactly 3 need to be provided.
Set [] to disable.
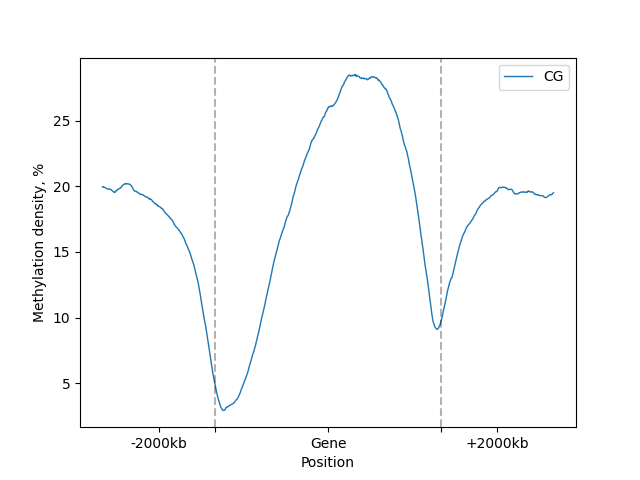
lp.draw_mpl(minor_labels=["-2000kb", "Gene", "+2000kb"])
lp.draw_mpl(minor_labels=[])
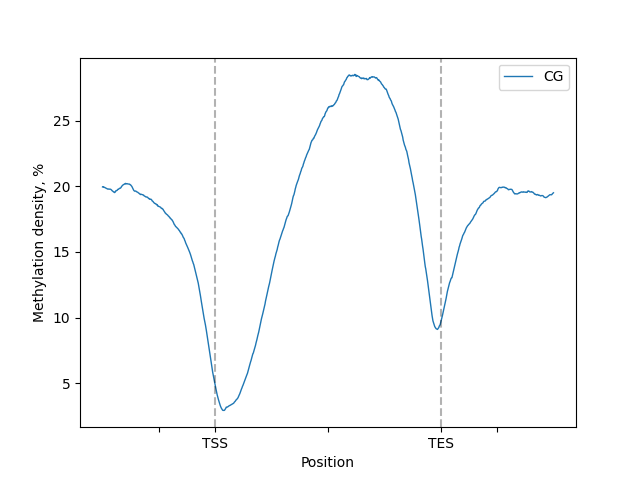
major_labels parameter
Labels for body region start and end (e.g. TSS, TES) can be changed to custom, but exactly 2 need to be provided.
Set [] to disable.
lp.draw_mpl(major_labels=["Start", "End"], minor_labels=[])

lp.draw_mpl(major_labels=[], minor_labels=["-2000kb", "Gene", "+2000kb"])